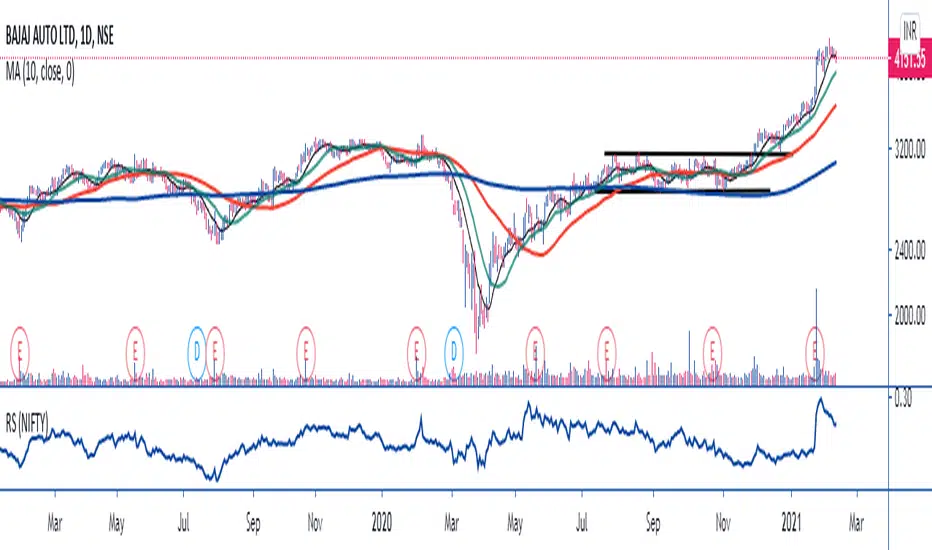
MAVERICKAMIT01-RELATIVE STRENGTHTHE SCRIPT SIMPLY DIVIDES THE STOCK PRICE BY NIFTY TO MEASURE UNDER PERFORMANCE AND OUT PERFORMANCE WITH NIFTY. YOU CAN CHANGE SETTINGS FROM NIFTY TO ANY OTHER SECTOR LIKE CNX FMCG TO MEASURE SECTOR PERFORMANCE AND UNDER PERFORMANCE !!!
Search in scripts for "the script"
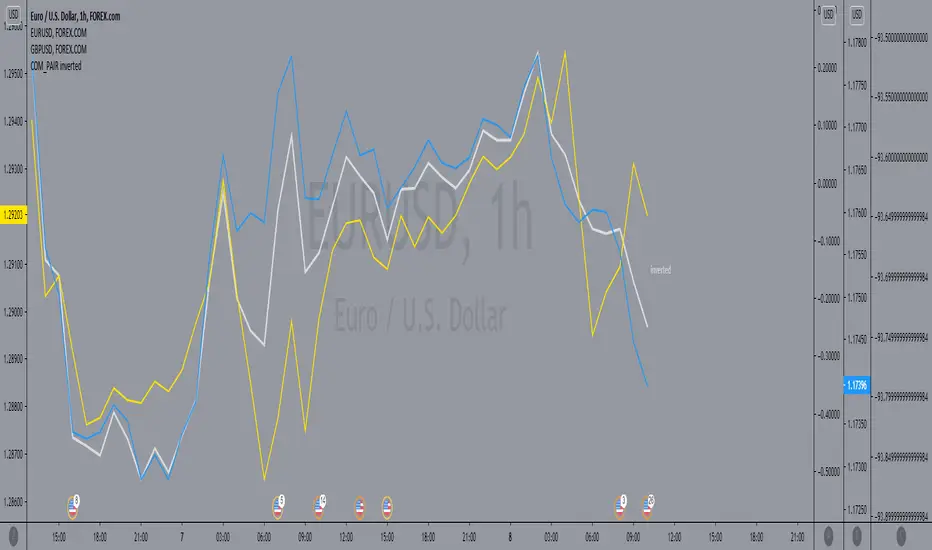
COM_PAIR invertedthe script make it easy on the eyes to compare the inverted symbols lines in comparison with the others, for example by utilizing TVC:DXY / FOREXCOM:USDCAD / FOREXCOM:USDJPY, you cab easily compare with them to EURUSD and GBPUSD.
Camarilla Scanner v1The script is based on Camarilla pivots for trend analysis of stock in intraday.
It will scan the selected stocks chosen in input settings displays the current status of where they are with respect to Camarilla pivots.
The day's history will show only those closed above R4/below S4.

Momentum Adjusted EMA TrendThe script draws a moving average which responds to trend changes extraordinary fast!
It's calculated using Momentum, Acceleration and Probability (Psychological Effect) by interfering the Golden Ratio!
I got the idea thanks to Tradingview user DGT (dgtrd) and his/her excellent descriptions.
The indicator is simplified for users and the default settings work great, so use it as you like specially as a trend indicator.

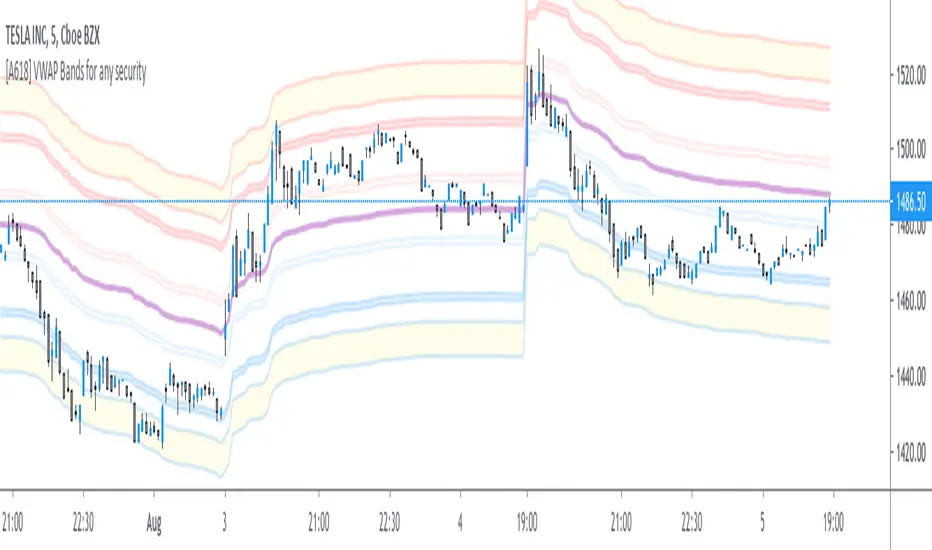
[A618] VWAP bands for any SecurityThe Script plots Standard Deviation Bands around The VWAP line,
This will help you out with detecting market overbought and oversold Conditions on the Fly
Use this in conjunction with an oscillator
- stoch, macd, etc...
- if you find a positive crossover with oscillator on a VWAP level its time to go long, targeting the next vwap level and vice-versa
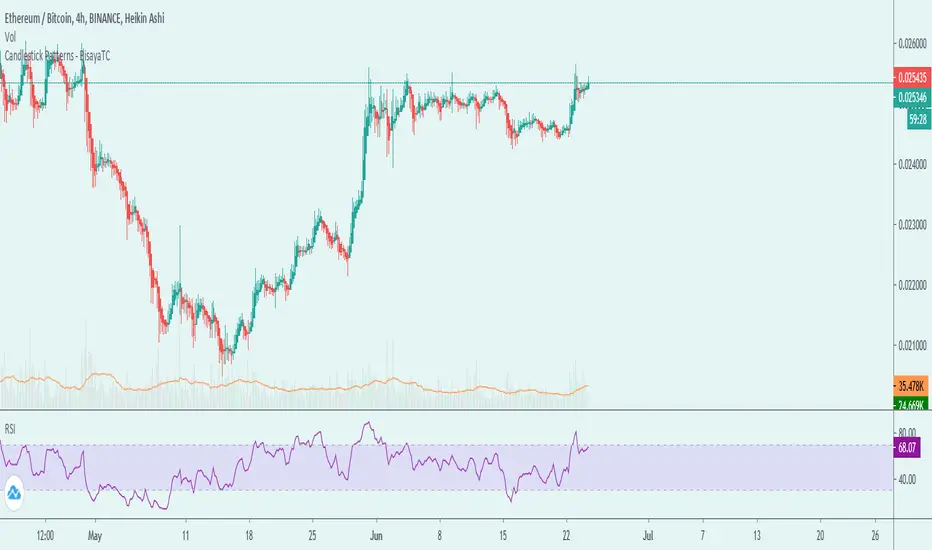
Candlestick Patterns - BisayaTCThe script displays a label when a candle stick pattern is detected based on Trends. This is related to the latest Candlestick patterns released in TradingView. I've created this to have all candlestick patterns in one indicator.
Candlestick Patterns can be one of confirmation of a trend you're following or a reversal.
DISCLAIMER: For educational purposes only. Nothing in this content should be interpreted as financial advice or a recommendation to buy or sell any sort of security or investment including all types of crypto. DYOR
Rolling midpointsThe script made for research purposes which plots these statistics of a given window: Mid-range (max + min)/2, Lower midpoint (mid-range + min)/2, and Higher midpoint (mid-range + max)/2.
This could be interesting when checking periods with sample size <= 0, or checking distros with srs kurtosis values.
Mean & median are also there.

Bull Club BiasThe script intends to eliminate noise from the chart. It uses a combination of multiple indicators into 1.
For long bias:
Close is greater than the ADX
15 Period EMA on close is greater than SMA on high
13 period RSI is greater than 25 periods RSI
MACD is greater than 0
For short bias:
Close is lower than the ADX
15 Period EMA on close is lower than SMA on high
13 period RSI is lower than 25 periods RSI
MACD is lower than 0
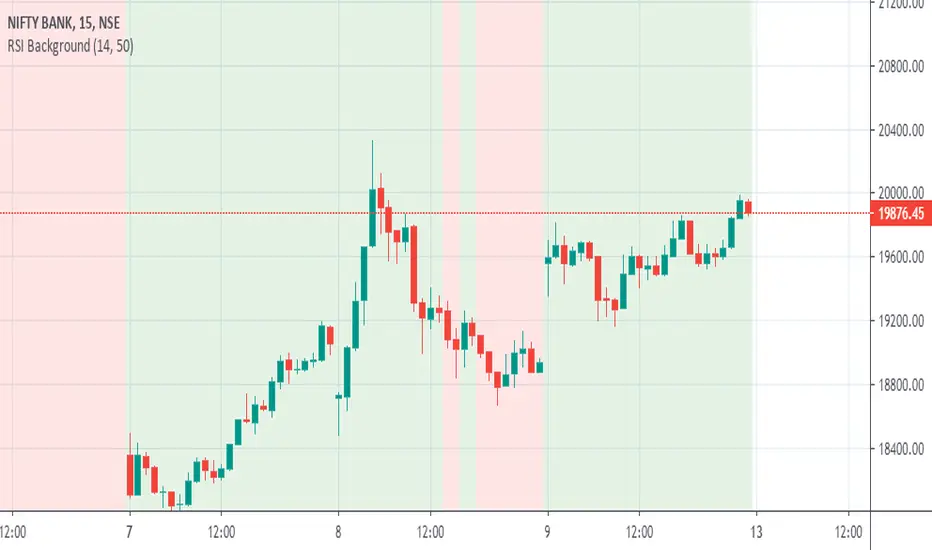
For every other combination, it is a range-bound bias. NSE:BANKNIFTY
A green background indicates long bias
A Red background indicates short bias
An Orange background indicates range-bound bias

RSI 50 BackgroundThe script changes the background depending on the RSI 14 values. If RSI 14 values is above 50 the background is green and if RSI value is below 50, the background will be red.
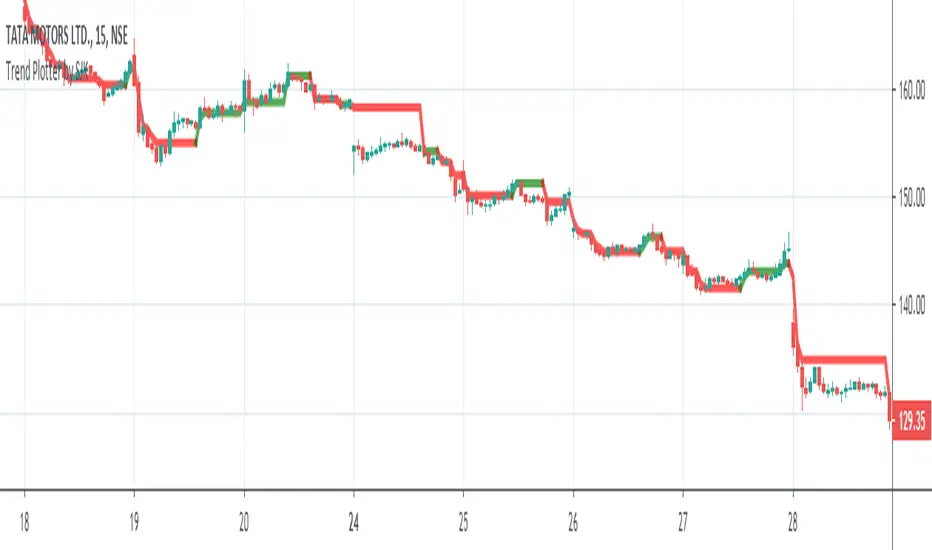
Trend Plotter by SJKThe script is on construction phase, but still can be used. This is a trend plotter based on ATR. Use a minimum time frame of 15 minutes. Wont work satisfactorily below that. Optimum is 30 minutes. Go short when the stock is under 200 day MA and go long when the stock is above 200 day MA. No buy or sell signal added, but can be used based on the color of the line plotted.
Higher Timeframe EMA @ silenThunderrThe Script is Used for Exponential Moving Average which are fixed for Daily and Weekly.
Can Be used in any Timeframe but EMA are fixed to Daily and Weekly only.
One option of Open EMA is kept which can be modified in settings.
Turn On/OFF various EMA's and enjoy the play of EMA's
Its can change colours if selected in the Settings.
OFFSET is also available.
Upslope is White and Downwards is Yellow. (I use Dark Theme hence White u can change the colour to what ever u wish )
All in settings

daddycooltechThe script is based on analysing the trend and following the patterns that develop once we have a signal of buy or sell developing on charts.
What doe it do?
it uses support and resistance along with transient zone strategy and identifies proper entry and exit levels.
How to use it?
for using this you need to follow the green or red triangles that are developing on charts and accordingly place buy or sell orders with a stop loss at a particular rejection level.
What market it is meant for?
it works in both bull n bear market with a condition of a proper time frame.This can't be used for scalping you should have patience while you try working with this strategy.

Stoch tripleThe script has combined the three Stochastic oscillators into one.
It analysed divergences of indicators depending on the flow of stock price, a circle mark or text mark displayed.
The maroon and red marks mean a fall, while the green and lime marks mean a rise.
Especially red and lime of mark are strong signs of decline or rise.
I hope you can make a successful investment by using three Stochastic oscillators properly.

5MAThe script contains five moving averages: MA50 , MA100 , MA200 , EMA30 , SMMA10 .
You can adapt it for yourself and use it on any markets.

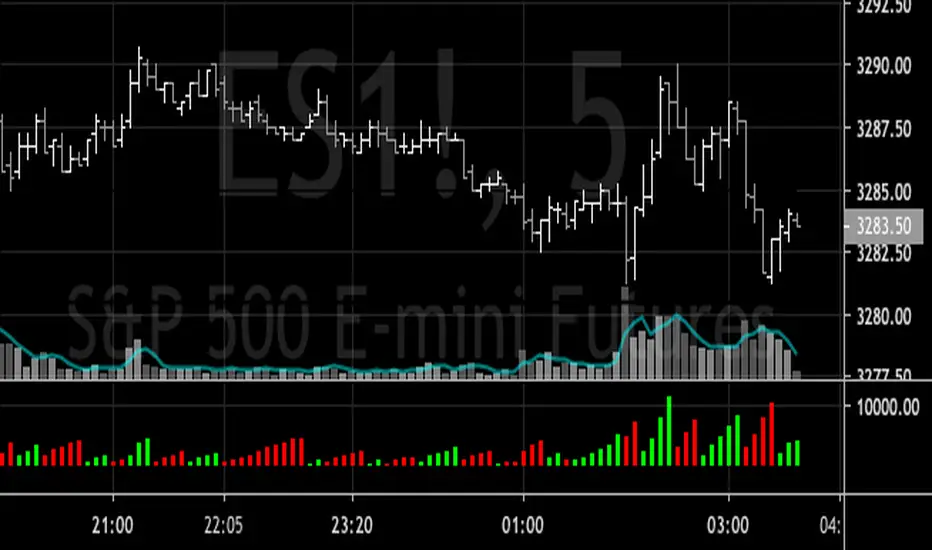
Bulls vs BearsThe script measures relative strenth of bull bars vs bear bars that complete the next rules:
1) rising price with rising volume calculates as bullish only if the next candle is higher
2) falling price with falling volume calculates as bullish only if the next candle is higher
3) rising price with falling volume calculates as bearish only if the next candle is lower
4) falling price with rising volume calculates as bearish only if the next candle is lower
examples
ethusdt
shitperp
bsvusdt
btcusdt

Cumulative VolumeThe script shows how to accumulate volume values during a defined session/period.
The input is the period to use for accumulation. "D" is the default value, useful to view data for each session.

IntraDay Pivot Lines, 30min IBThe script draws critical lines for IntraDay traders:
1) High/Low of the last Month - in Red/Green thick line
2) High/Low of the last Week - in Red/Green
3) High/Low of the first 30minute of the current trading day - in Yellow
4) High/Low of the first 5min of the trading day - in Grey
Two Lines Diferent M (derivate)The script is only for information about two lines of diferent derivates, one with 10 candles and the another with 30 candles, the diferent slope of those lines tangents shows an indication of a tendencial if the value of the instrument is bearish or bullish.
Its aplicable to all instruments in high volatility times.
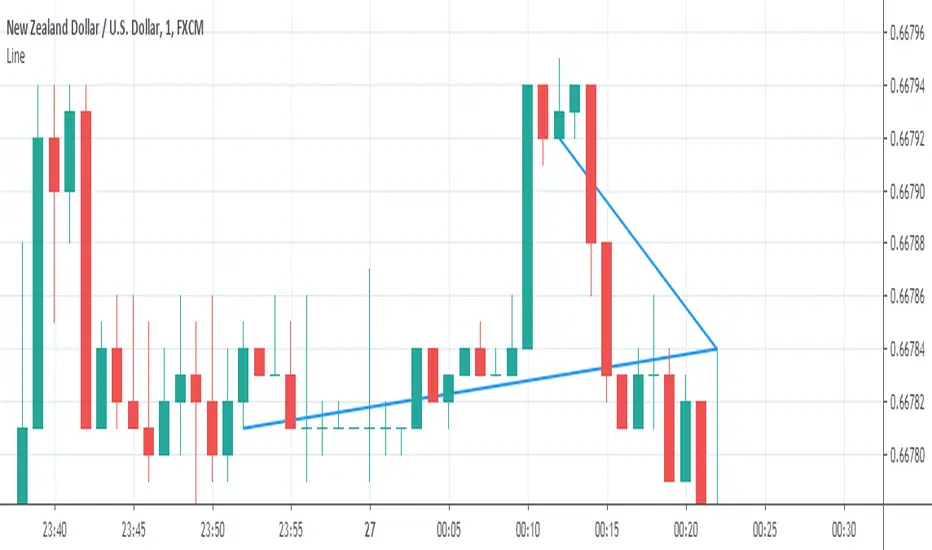
Support and Resistance plotterThe script uses high/low/higher high/lower low for Support and Resistance identification but takes into account only pivots with wick making low/high opposite to candle body. Such candles point to hard market swings into during candle timeframe.
Price usually come bake to such levels and make double top/bottom, divergences on different osc or starts a new trend if this level is broken.
If Support lvl and Resistance lvl meets the movement of price in the direction from this combined lvl is much accelerated.
examples

Rolling Moving Average, SMA/EMA, for IPO stocksThe script replicates the standard EMA/SMA used by tradingview, but also adds an estimate for the first X periods, where X is the length of the moving average. This allows for an estimate of support resistance in IPO stocks, when fewer date is available


Max of VWAP of last three daysThe script searches for max values of last three days and then calculates average of those values
